
Annual Report Designing in Sialkot
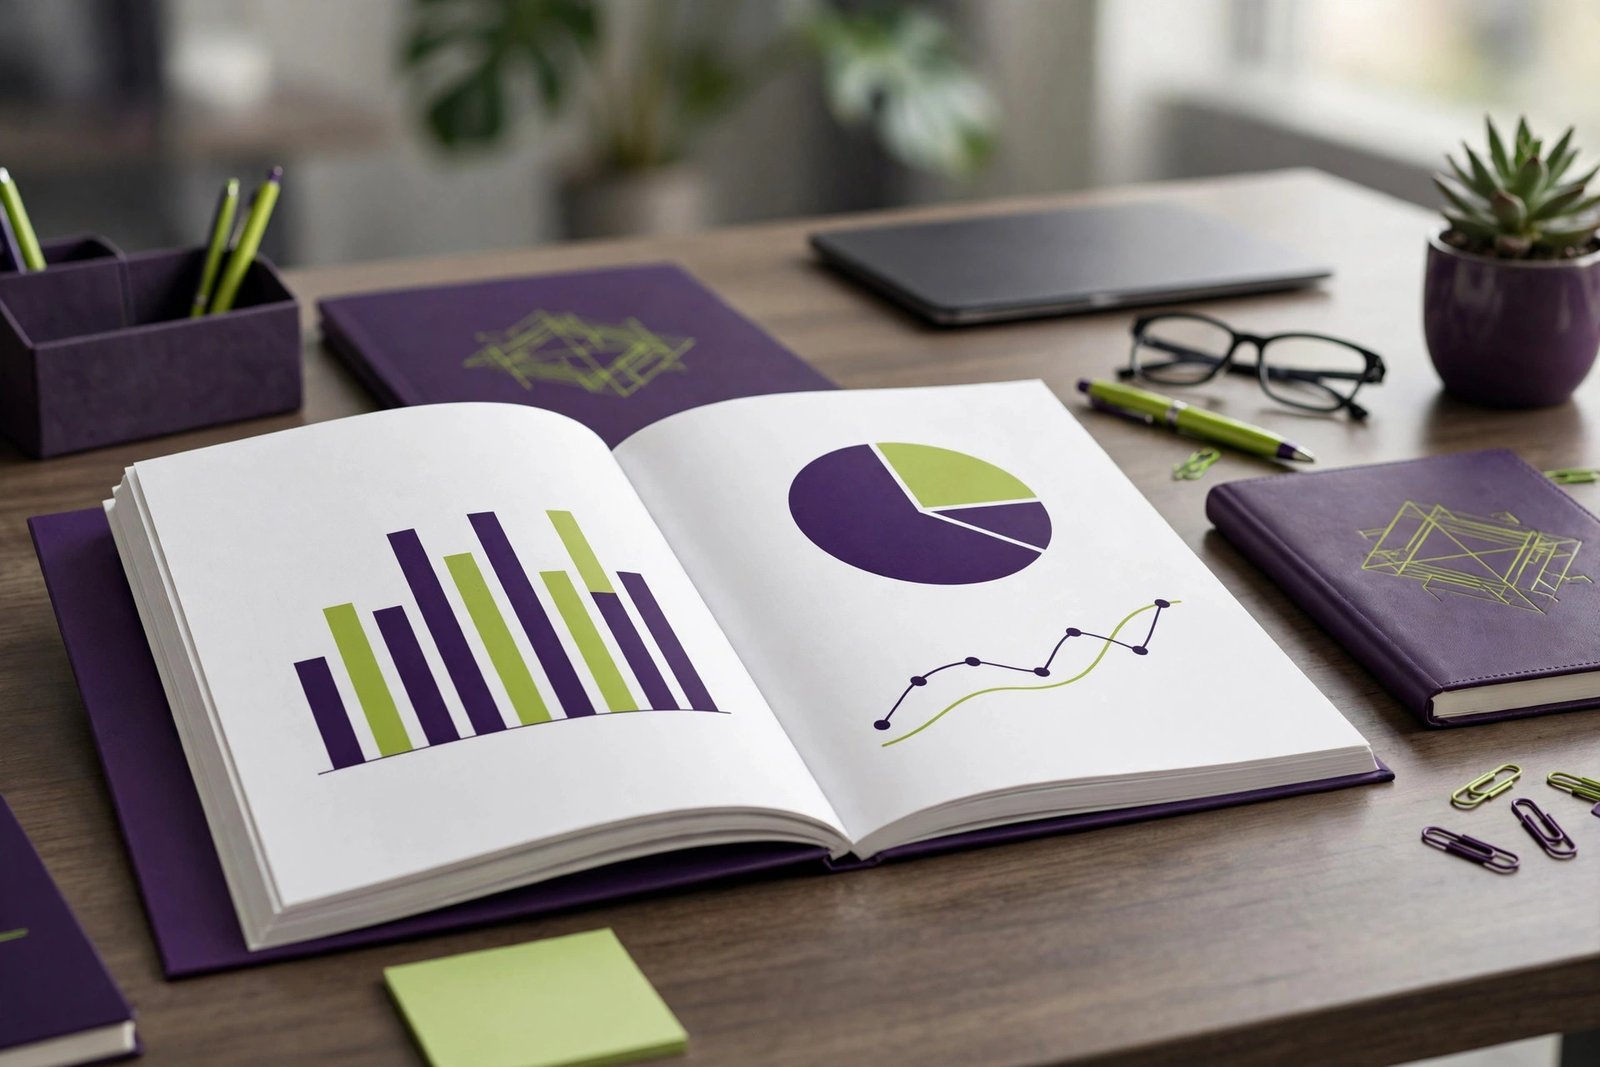
Once a year, your company tells its story. Not in a meeting, not in an advertisement — in your annual report. This document goes to shareholders, partners, banks, and sometimes the public. It presents your financial performance, your achievements, your challenges, and your plans. And whether people actually read it — and what they think of your company afterward — depends heavily on its design.
Too many annual reports are designed as an afterthought: dense tables, tiny text, generic layouts. The result is a document nobody wants to read, which defeats its entire purpose. A well-designed annual report does the opposite. It turns numbers into clear visual stories, guides readers through the year's highlights, and leaves them with a strong impression of a capable, trustworthy company.
At Advert Solutions, we design annual reports with clear layouts, professional charts, and attractive visuals that present your company's performance at its best. Whether your readers are shareholders, bankers, buyers, or employees, we make sure your report speaks to each of them clearly and convincingly. In this comprehensive guide, we will explain why annual report design matters, what goes into a professional report, how our design process works, how we turn numbers into visual stories, which mistakes to avoid, and what annual report design costs in Sialkot.
Why Annual Report Design Matters
An annual report is one of the most important documents your company produces. It is also one of the most design-sensitive. Here is why the design deserves serious investment.
It shapes how stakeholders see your company. Shareholders, investors, banks, and partners judge your company's competence partly through its annual report. A polished, professional report signals a well-managed organization. A sloppy, confusing report raises doubts — if the company cannot present its own results clearly, what else might be disorganized? This judgment may be unfair, but it is real, and it affects real decisions about investment and partnership.
Good design makes financials understandable. Annual reports are full of numbers: revenue, profit, growth rates, expenses, assets. Presented as dense tables, these numbers blur together and readers give up. Presented as clear charts with thoughtful design, the same numbers tell a compelling story — growth over five years, profit margins improving, new markets contributing. Design is what turns data into understanding. For non-financial readers like many shareholders, this visual clarity is the difference between engaging with the report and ignoring it.
It builds trust through transparency. A well-organized report that presents both achievements and challenges honestly builds credibility. Design supports this by making information easy to find and verify — clear section navigation, consistent data presentation, honest chart scales. When readers feel the company is being straight with them, trust grows. Trust is the currency of investment.
It is a marketing tool, not just a compliance document. Smart companies use their annual report as a brand showcase. Beyond the numbers, the report tells the company's story: its mission, its people, its impact, its vision. Beautiful photography, employee spotlights, and well-designed feature pages turn a compliance document into a brand asset. Banks, potential partners, and job candidates all read annual reports — each one is an audience worth impressing.
It has a long shelf life. Annual reports stay in circulation for years. They sit on shelves, get referenced in meetings, and get compared year over year. A timeless, professional design ages well. A trendy or careless design looks dated quickly. We design annual reports with a classic, enduring quality.
Consistency across years matters. Readers compare this year's report with last year's. Consistent design — same structure, same chart styles, same branding — makes year-over-year comparison easy and shows organizational stability. We can establish a design system for your reports that carries forward elegantly each year, with fresh covers and updated content.
Regulatory and formal expectations. In many contexts, annual reports must meet formal standards — for listed companies, banks, or organizations with governance requirements. Professional design ensures the report looks appropriate for its formal purpose while remaining readable and engaging.
Digital distribution is now standard. Annual reports are emailed, hosted on websites, and shared with distant stakeholders. We prepare print-quality files plus web-optimized digital versions, so your report looks excellent in both formats. Interactive PDFs with clickable navigation make digital reports genuinely pleasant to read.
Your annual report is your company's yearly statement to the world. Its design should reflect the quality of the business it describes.
Think about the journey of a single annual report. It gets emailed to shareholders across the country. It sits on a bank manager's desk during a loan review. An international buyer downloads it from your website before a factory visit. A job candidate reads it before an interview. Each of these readers forms an opinion about your company — and the design shapes that opinion before they process a single number. A report that looks excellent tells every reader the same thing: this is a company that takes itself seriously. That message, repeated to every stakeholder, is worth far more than the design cost.
What Goes Into a Professional Annual Report
A complete annual report has many sections, each needing thoughtful design. Here is what a professional report typically includes and how we design each part.
Cover. The cover sets the tone for the entire report. It should feel substantial and reflect the year's theme — growth, resilience, innovation, or whatever story the numbers tell. We design covers that are elegant and confident, never gimmicky. Many companies use a visual theme that runs through the whole report, starting with the cover.
Chairman's and CEO's messages. These opening letters carry the leadership's voice. The design should give them prominence — generous white space, professional portrait photography, elegant typography. These pages are widely read, so they deserve feature-level design treatment.
Financial highlights. The key numbers at a glance: revenue, profit, growth, dividends. We design these as visual highlight pages — big numbers, clean charts, clear comparisons with previous years. A reader should grasp the year's performance in thirty seconds from these pages alone.
Operational review. What the company did during the year: new products, new markets, expansions, milestones. This section benefits from photography, timelines, and feature-style layouts that make business activities feel dynamic and real.
Financial statements and charts. The heart of the report: profit and loss, balance sheet, cash flow. Raw tables are necessary, but we surround them with visual summaries — five-year trend charts, segment breakdowns, ratio visualizations. The goal is that both financial experts and general readers find what they need. Chart design here must be precise: accurate scales, clear labels, consistent colors across all charts.
Corporate governance. Board members, committees, governance practices. This section needs a formal, trustworthy design — professional portraits, clean organizational charts, clear text layouts.
Corporate social responsibility. Community work, environmental efforts, employee welfare. CSR sections humanize the company. We design them with warm photography and engaging layouts that show genuine impact, not just claims.
People and culture. Employee stories, team photos, workplace highlights. These pages show the human side of the business. Good design here builds employer brand — the report gets read by potential hires too.
Future outlook. Plans, strategies, and vision for the coming year. Forward-looking design — clean, optimistic layouts that convey direction and confidence.
Shareholder information. Practical details: shareholding patterns, dividend history, contact information. Clear, organized layouts make this reference material easy to use.
Each section serves a different purpose and a different reader. Our job is to design every section appropriately while keeping the whole report visually unified. For companies that also need a general corporate introduction, our company profile design service creates a complementary publication with the same professional standards.

Our Annual Report Design Process, Step by Step
Annual reports are complex, high-stakes projects. Our structured process ensures nothing is missed and the final document is flawless. Here is how we work.
Step 1: Discovery and planning. We meet with your team to understand the report's purpose, audience, and scope. Is this for shareholders, a bank, or public distribution? How many pages? What is the year's key story? We also discuss last year's report — what to keep, what to improve. From this, we create a detailed flat plan: a page-by-page map of the entire report.
Step 2: Content gathering. You provide the content: financial data, chairman's message, section texts, photographs, charts data. We organize everything and identify gaps — missing figures, photos that need retouching, text that needs final approval. Annual report content often comes from multiple departments, so we help coordinate what is needed from whom. Financial data must be final and verified before design begins; designing around changing numbers wastes everyone's time.
Step 3: Design concept. We develop the visual concept: cover options, sample inside spreads, chart styles, and the overall theme. You review and approve the direction. For established companies, we evolve last year's design; for first-time reports, we create a fresh identity. This approval step is critical — it locks the visual direction before the heavy layout work starts.
Step 4: Chart and infographic design. Financial data gets special treatment. We rebuild every chart from your verified numbers — no copied Excel defaults. Each chart is designed for clarity and accuracy: proper scales, readable labels, consistent styling. Infographics translate complex information — like business models or five-year journeys — into visuals anyone can understand.
Step 5: Full layout. We lay out every page according to the flat plan and approved design system. Text flows into designed columns, photos are placed and captioned, charts are integrated with surrounding narrative. This is meticulous work — a 60-page report means 60 pages of careful decisions.
Step 6: Internal quality check. Before sharing with you, we check our own work: page numbers in sequence, consistent headers and footers, chart accuracy against source data, photo quality, spelling of names and titles. We catch our mistakes before you see them.
Step 7: Client review rounds. We share the full report as a digital proof. Your team reviews everything — and for annual reports, multiple reviewers are essential: finance checks the numbers, management checks the messages, marketing checks the brand. We typically go through two to three review rounds.
Step 8: Final proof and sign-off. After revisions, we prepare a final proof for formal sign-off. For annual reports, this sign-off should come from senior management — the document represents the company officially. We recommend a printed proof at this stage, because some issues are only visible on paper.
Step 9: Print preparation. We prepare print-ready files to your printer's exact specifications: correct color profiles, bleed, high resolution. Annual reports are premium print jobs — we specify paper recommendations and finishes (like matte lamination or spot UV on the cover) that give the report a substantial, quality feel.
Step 10: Digital version. We create a web-optimized version with clickable table of contents and navigation, sized for email and website hosting. Many stakeholders will only ever see the digital version, so it must be excellent.
A typical 40 to 60 page annual report takes 4 to 6 weeks from final content to finished files. We provide a detailed timeline with milestones so your team can plan around board meetings and publication deadlines. If your report must be ready for a specific event — an annual general meeting, a board presentation, a regulatory filing date — tell us at the very start. We plan backward from your deadline, building in buffer time for reviews, because annual reports always involve more reviewers and more rounds than anyone expects.
Turning Numbers Into Visual Stories
The hardest part of annual report design — and the most valuable — is transforming raw financial data into visuals that anyone can understand. Here is how we approach data visualization in annual reports.
Choose the right chart for the message. Different charts answer different questions. Bar charts compare values across categories — revenue by quarter, sales by region. Line charts show trends over time — five-year profit growth. Pie or donut charts show composition — revenue split by product line. We select chart types based on what the data needs to say, not what looks fancy. A wrong chart type confuses; the right one clarifies instantly.
Keep charts honest. This is non-negotiable. Chart scales must start at zero for bar charts (truncated scales exaggerate differences). 3D effects that distort proportions are never used. Colors must not mislead. An annual report's credibility depends on honest data presentation — we design charts that are both beautiful and truthful.
Highlight the key insight. Every chart should make one point obvious. We use color, annotations, and callouts to draw the eye to what matters: "Revenue grew 24%," "Exports now 60% of sales." Readers should not have to study a chart to understand it — the insight should be immediate.
Maintain consistency across all charts. The same color always means the same thing throughout the report. The same chart style is used for the same type of data. This consistency lets readers compare across pages effortlessly. We create a chart style guide at the start and apply it everywhere.
Pair charts with narrative. A chart alone is data; a chart with a clear headline and a sentence of context is a story. We design chart pages where the visual and the text work together: the headline states the insight, the chart proves it, the caption adds detail.
Use infographics for complex ideas. Some things do not fit in charts: how the business model works, the company's journey over a decade, the supply chain, the sustainability approach. Custom infographics turn these complex topics into clear visuals. We design infographics that simplify without dumbing down.
Make numbers scannable. Key figures get big-number treatment — large, bold, impossible to miss. Supporting numbers stay smaller. This hierarchy lets busy readers scan the highlights while detail-oriented readers find the depth they want.
Design for both experts and general readers. Financial experts want the full statements; general shareholders want the story. We layer the design: visual summaries and highlights for scanners, complete tables for those who want depth. Both audiences leave satisfied.
Great data visualization is invisible — readers simply understand. Achieving that invisibility takes deliberate, skilled design work on every chart and every number.
Real Examples: Annual Reports That Build Confidence
Here are typical annual report projects showing how professional design serves different organizations.
The manufacturer's first professional report. A Sialkot sports goods manufacturer had been producing basic, text-heavy annual reports for years. For a year of strong growth, they wanted a report that matched their success. We designed a premium report with a confident cover, visual financial highlights, factory photography, and clean charts. They presented it to their bank while discussing expansion financing. The bank's team commented positively on the professionalism — and the financing was approved. Correlation is not causation, but presenting well never hurts.
The group's consolidated report. A business group with three companies needed one consolidated annual report. The challenge: three different businesses, one coherent story. We designed a structured report with color-coded sections for each company, unified by an overarching group identity and consistent chart styles. Readers could follow each business separately or see the group picture. The design made complexity feel organized.
The NGO's impact report. A non-profit needed an annual report focused on impact rather than profit: beneficiaries reached, programs run, funds utilized. We designed it as a visual story — large impact numbers, beneficiary photos, program timelines, transparent fund breakdowns. Donors respond to clarity and emotion; the report delivered both. Donation inquiries increased after distribution.
The school's annual review. A school group published an annual report for parents and trustees: academic results, facility improvements, financial summary. We designed it to be readable for non-financial readers — visual result summaries, photo-rich activity sections, clear financial overview. Parents felt informed and confident about the institution.
In each case, the design did not change the facts — it changed how the facts were received. That is the power of professional annual report design.
Common Annual Report Design Mistakes to Avoid
Annual reports are high-visibility documents, so mistakes are costly. Here are the most common ones.
Mistake 1: Starting design before numbers are final. Designing around draft financials means redoing charts when numbers change. Always finalize financial data before design begins. We insist on this — it saves everyone time and prevents errors.
Mistake 2: Dishonest or confusing charts. Truncated axes, cherry-picked time periods, 3D distortions — readers and analysts spot these instantly, and they destroy trust. We design charts that are scrupulously honest.
Mistake 3: No clear narrative. A report that is just sections stapled together — financials here, messages there, no connecting story — feels disjointed. We help structure a narrative arc: where the company was, what happened this year, where it is going.
Mistake 4: Poor photography. Blurry factory photos or awkward team pictures undermine a premium report. We advise on photography needs early so there is time to arrange proper shoots.
Mistake 5: Inconsistent branding. When the report's design does not match the company's brand — different colors, different logo treatment — it feels disconnected. We align every report with the company's established identity, starting from the logo outward.
Mistake 6: Ignoring the digital reader. Designing only for print and exporting a massive, unnavigable PDF wastes the digital audience. We build digital versions with navigation and optimization from the start.
Mistake 7: Typos in a formal document. A spelling error in an annual report is embarrassing at best and damaging at worst. Multiple proofreading rounds by different people are essential. We check design elements; your team must verify all text and numbers.
Mistake 8: Burying the highlights. If readers must dig to find the key results, most will not bother. Financial highlights belong up front, designed for instant comprehension.
Mistake 9: One-size-fits-all layout. Using the same template for every section ignores that different content needs different treatment. Financial tables, photo features, and messages from leadership each deserve appropriate layouts within one unified system.
Mistake 10: Rushing the final proof. Deadline pressure often compresses the final review. But the final proof is where costly errors are caught. We build realistic timelines that protect review time — and we recommend printed proofs for the final check.
Annual reports leave no room for amateur work. Every detail is scrutinized by people whose opinions matter to your business.
What to Check Before Hiring an Annual Report Designer
Annual report design requires financial literacy plus design skill — a rare combination. Verify these points before hiring:
- Ask to see complete annual reports. Not just covers or sample pages — full reports. Check how they handle financial sections, not just the pretty parts.
- Test their chart work. Look closely at charts in their past work. Are scales honest? Are labels readable? Do charts actually clarify the data?
- Check financial document experience. Ask whether they have designed financial or corporate documents before. Annual reports have conventions and expectations that general designers may not know.
- Confirm confidentiality. Annual reports contain sensitive financial data before publication. The designer must guarantee strict confidentiality — a signed NDA if you require it.
- Ask about the review process. How do they handle multiple reviewers from your team? A good process tracks every comment and confirms every change.
- Discuss timelines realistically. Get a milestone-based schedule. Be wary of anyone who promises a 60-page report in a week — rushing guarantees mistakes.
- Confirm print expertise. Premium paper, binding options, finishes — the designer should advise on physical production, not just screen design.
- Check digital deliverables. Interactive PDFs with navigation should be standard, not an afterthought.
The right designer understands that an annual report is a trust document. Every design choice should reinforce credibility.
Designing for Different Readers: Shareholders, Banks, and the Public
One annual report, many readers — and each reader wants something different. Professional annual report design serves all of them without compromising. Here is how we think about each audience.
Shareholders and investors. They want to know: How did my investment perform? Is the company growing? What are the risks? For them, we design prominent financial highlights, honest trend charts, clear dividend information, and a readable chairman's message. Numbers must be easy to find and easy to trust. Small shareholders may not read the full financial statements, so the visual summaries carry the weight. We make sure those summaries are complete and accurate — never misleading.
Banks and lenders. Banks read annual reports when evaluating loans and credit limits. They focus on financial health: profitability, cash flow, debt levels, asset quality. For this audience, the financial sections must be immaculate — clean statements, proper notes, professional presentation. A well-designed financial section signals a well-managed company. Banks notice the difference between a careless report and a professional one, and it subtly influences their confidence.
Business partners and buyers. For Sialkot's exporters, international buyers and partners often review annual reports during due diligence. They look for stability, scale, and professionalism. Factory photography, capacity information, export market breakdowns, and certification displays matter to them. We design these sections to answer a buyer's unspoken question: "Is this a company I can rely on for years?"
Employees. Your team reads the annual report too — or at least, they should. An engaging report with employee stories, clear explanations of results, and a compelling vision for the future builds pride and alignment. When employees understand the company's performance and direction, they work with more purpose. We design people sections that celebrate the team genuinely.
Regulators and the public. Where reports are publicly filed or shared, they must meet formal expectations while remaining accessible. We balance regulatory completeness with readable design — the required disclosures are all present and properly formatted, but the report never feels like a legal burden to read.
Media and analysts. Journalists and analysts skim reports looking for stories: growth figures, new initiatives, notable quotes. Clear headlines, quotable highlights, and well-designed data pages make their job easy — which means your story gets told accurately. We design with these professional readers in mind, ensuring key messages are impossible to miss.
How one design serves all. The secret is layering. Every spread works on multiple levels: big headlines and visuals for scanners, summaries for general readers, complete data for specialists. A shareholder skimming gets the story from highlights. An analyst digging in finds the full statements. A buyer browsing sees the credibility. Good information architecture — clear navigation, consistent structure, thoughtful hierarchy — is what makes this multi-audience design possible. It is one of the most demanding aspects of annual report design, and one of the most valuable.
When we plan your report, we ask who will read it and design accordingly. A report for a family-owned exporter and a report for a publicly listed company need different emphases — we get that balance right.
Annual Report Design Pricing in Sialkot
We do not publish fixed prices, and here is why, honestly: annual reports vary enormously in scope. A 24-page report for a small company is a different project from an 80-page group report with consolidated financials, custom infographics, and premium finishing. Meaningful fixed pricing is impossible.
Here is what determines the cost:
- Number of pages. The primary factor. More pages mean more layout, more charts, more review cycles.
- Data complexity. Simple financials are straightforward. Consolidated group accounts, segment reporting, and complex notes take more chart and layout work.
- Custom infographics. Standard charts are one level; bespoke infographics explaining business models or strategies take dedicated illustration time.
- Photography needs. If we work with your existing photos, that is one thing. If the project needs art direction for new photography, that adds planning.
- Content readiness. Final, verified content moves fast. Draft content that changes repeatedly slows everything and adds cost.
- Review complexity. More reviewers and more rounds mean more coordination. We include standard rounds; extensive additional rounds are quoted honestly.
- Digital extras. Interactive PDFs, web versions, and presentation summaries add deliverables.
To give you a rough sense: shorter reports of 20 to 32 pages are the most accessible. Standard corporate reports of 40 to 64 pages are mid-range projects. Large, premium reports of 64+ pages with extensive custom graphics are significant investments.
What we promise is complete transparency. You receive a detailed written quote based on your page count, content complexity, and timeline — before any work starts. No hidden charges, ever. If scope changes mid-project, we discuss it openly first.
One honest consideration: your annual report is read by the people who decide your company's future — investors, banks, partners. The design investment is small compared to the financial decisions it influences. This is not the document to cut corners on.
Many of our annual report clients also need presentation designs for shareholder meetings and magazine-style publications — we keep all of them visually consistent. Want an exact price? Contact us for a free quote or call +92 371 4200173. Share your page count and timeline, and we will reply with a clear, detailed quote — free, with no obligation.
One more thing worth knowing: annual reports are read by people who decide where money goes. Bank officers, investors, and big buyers all look at your report before they trust you with serious business. A clean, well-designed report tells them you are organized and serious. A messy one does the opposite, even if your numbers are good. That is why the design of your annual report is not decoration. It is part of how your company is judged.
Frequently Asked Questions
How long does it take to design an annual report?
A 24 to 32 page report typically takes 3 to 4 weeks from final content to finished files. A 48 to 64 page report takes 4 to 6 weeks. Larger reports take longer. The timeline assumes your financial data and text content are final when design begins. Content delays — waiting for numbers or approvals — are the most common cause of extended timelines, so finalize content early.
What do you need from us to start?
Final financial data and statements, the chairman's and CEO's messages, section texts, high-quality photographs, your logo and brand guidelines, and last year's report if one exists. The single most important requirement is finalized numbers — designing around changing figures causes errors and delays. We provide a content checklist so your team knows exactly what to prepare.
Will our financial data stay confidential?
Absolutely. We treat all pre-publication financial data as strictly confidential. We never share, discuss, or reuse client financials. If your company requires a formal non-disclosure agreement before sharing data, we sign it without hesitation. Confidentiality is foundational to annual report work.
Can you design charts from our raw financial data?
Yes. Send us your figures in any format — Excel sheets, accounting software exports, even scanned statements — and we rebuild them as clean, accurate, professional charts. We verify every number against your source data and design each chart for both honesty and clarity. You approve every chart before finalization.
Do you handle Urdu content in annual reports?
Yes. If your report includes Urdu sections — common for local stakeholder messages — we handle Urdu typography professionally with proper fonts and right-to-left layout. Bilingual reports are designed so both languages feel equally polished.
Can you match last year's report design?
Yes. If you have an existing report series, we study last year's design and evolve it — keeping the structure and identity readers recognize while refreshing and improving the details. Consistency across years is valuable, and we protect it. Readers who compare reports year over year should feel continuity, not disruption. If you prefer a complete redesign, we handle that too, with a transition plan that carries forward the best elements of the old design while giving the report a fresh, modern feel.
Do you also print annual reports?
We deliver print-ready files prepared to your printer's exact specifications, and we advise on paper, binding, and finishes for a premium result. Annual reports deserve quality printing — we help you specify it correctly. We work with any professional printing press.
Will we get a digital version for our website?
Yes. Every annual report includes a web-optimized digital version with clickable navigation — table of contents links, section bookmarks — sized for fast loading. Many stakeholders only see the digital version, so we design it to be genuinely pleasant to read on screen, not just a shrunken print file. The digital version also makes distribution effortless: email it to shareholders, host it on your website, share the link with partners. In today's business environment, a report without a good digital version is only doing half its job.
How many review rounds are included?
We include structured review rounds — typically two to three full proofs. Given the number of stakeholders involved in annual reports, we use a tracked review process: every comment is logged, every change is confirmed. This prevents the confusion of conflicting feedback from multiple reviewers.
Do you work with companies outside Sialkot?
Yes. We design annual reports for companies across Pakistan. The entire process — discovery calls, content exchange, design reviews, final delivery — works smoothly online. Financial confidentiality and professional process are maintained regardless of location.
Present Your Year with the Quality It Deserves
Your annual report is your company's official story of the year. It deserves design that matches the effort behind the results. Clear layouts, honest charts, beautiful visuals, and flawless production — these turn a compliance document into a statement of who you are as a company.
At Advert Solutions, we bring financial document expertise, data visualization skill, and premium print knowledge to every annual report project. We handle the complexity — the charts, the sections, the reviews, the print specs — so your team can focus on the content.
Whether this is your company's first professionally designed report or the next in an established series, we will make it worthy of the year it represents. The numbers tell what happened; the design tells readers what it means. Both deserve excellence, and both get our full attention on every single page we create for you.
Ready to create an annual report you are proud of? Get a free quote today or call us at +92 371 4200173. Tell us about your report — page count, timeline, and audience — and we will design a document worthy of your company's year. The sooner we start, the more time we have to get every detail right.
We do this for businesses.
Get a free consultation — we'll map the fastest path for you.